A Guide to Soil Moisture
AG Technology Consultant
Introduction
Your crops need water to grow and produce, but knowing how much to irrigate and when is critical to having the healthiest crop and achieving the best yields possible. In this era of climate change and increasingly unpredictable weather, farmers need to rely more and more on irrigation. At the same time, the agriculture industry is under increasing pressure to conserve water and maintain water quality.
This article describes how to use the data provided by soil moisture probes to more effectively plan your irrigation strategy. Observing and understanding the consequences of soil moisture fluctuations in your crops’ root zone will enhance your efforts to maximize yield, improve crop health, and use precious water resources efficiently. This article will cover:
ConnectedCrops provides the latest in advanced in sensor technology, cost-effectiveness and ease of use to bring farmers a new level of real-time visibility to what’s happening in their fields.
Why monitor soil moisture?
Knowing how much soil moisture (see definition) is available in real-time can lead to several positive outcomes.
Higher yields
Growers report that using soil moisture measurements has led to a 10% increase in yield. University case studies have demonstrated yield increased by as much as 20% for some crops, in addition to faster growing cycles by using soil moisture measurements effectively.
Plant health and disease prevention
Irrigation has been shown to both increase and decrease the growth of various plant diseases. Knowing your crop, the diseases it is most likely to encounter and how irrigation impacts that disease’s propagation is critical for every farmer.
Under-irrigating will lead to plant stress, poor overall plant health, and a more disease-prone crop. For example, water stress in the formative stages of potato growth can lead to increasing incidents of common scab.
Over-irrigating can, amongst other negative impacts, create an environment conducive to the growth of other disease pathogens. Many soil-borne diseases rely on wet conditions for development, transmission, and movement. Conditions promoting soil diseases can occur with improper irrigation. Rapid water application to clay-based soils leads to water runoff and disease movement within and possibly between fields. Clay soils should be irrigated slowly and for long periods to allow water to penetrate and for soil to adequately absorb moisture throughout the root zone.[1]
Since irrigation is a necessity for most crops in Canada, knowing exactly when and how much to irrigate to promote the healthiest plant possible, is the best disease prevention strategy.
Increased water efficiency and reduced irrigation costs
Freshwater availability to support an expanding agricultural sector needs to be balanced against competing demands for domestic water supply, water for industrial processing, and to support environmental ecosystems. A changing climate with greater rainfall uncertainty will exacerbate this competition and result in severe challenges in managing and allocating freshwater supplies. With agriculture accounting for nearly three quarters (70%) of all freshwater withdrawals and over 90% of total consumptive water use[2] this will inevitably lead to periods where demand exceeds available water supplies. In short, the agricultural sector needs to do more with less, increasing water efficiency through precision irrigation.
Considering the time and cost associated with irrigation and disease prevention, it makes sense to invest in technology that provides real-time soil moisture levels and simplifies your irrigation decisions.
[1] https://www.canr.msu.edu/news/irrigation_and_disease_development_in_michigan_vegetables
[2] https://hess.copernicus.org/articles/14/1863/2010/
What is soil moisture and how do you measure it?
Soil moisture (or Soil Water Content – SWC) is the amount of water present in the soil. Not only does it influence plant growth, but it also influences the transportation of nutrients to the plant, and soil temperature.
There are two measurement methods used for determining soil water content:
- Gravimetric Water Content
- Volumetric Water Content
Gravimetric Water Content
The Gravimetric Water Content (GWC) method measures soil moisture by collecting an exact volume of soil from a field. The sample is weighed, placed in an oven to remove all the water, and then weighed again. The weight difference between the initial weight and dried weight represents the weight of the water that was baked out of the sample. The ratio of water weight to dry solids weight is the GWC%.

Equation 1
This is called a gravimetric measurement method as it compares the mass of the sample before and after the water is removed (not volume); however, the result is still expressed as a % of water in a sample. This method is the most accurate measurement method available to date and is the baseline to which all other measurement techniques are compared and calibrated against.
While most accurate, this method requires the manual collection of field samples, is time intensive, and requires precision lab equipment for analysis. It is not practical for monitoring soil moisture over a period of time.
There is no in situ method for measuring GWC%. It can only be performed in a lab.
Volumetrics Water Content
Volumetric Water Content (VWC) is the ratio of the volume of water to the volume of a soil sample, expressed as a percentage or ratio. Within a sample of soil, you will have the basic components of:
- organic matter
- soil minerals
- air
- ice (in some climates over winter)
- water
So as an example, if the VWC% is determined to be 25% (or 0.25), then it means in 1.0 cubic metre of soil:
- 25 cubic meters of it is water (250 liters), and
- 75 cubic meters of it is organic matter, soil minerals, air, and ice.

Equation 2
Measuring (or more accurately calculating) volumetric water content can be performed by in situ sensor systems. What properties of the soil are measured and how these properties are measured will determine the accuracy of the VWC% calculation and the cost of the sensor. The measurement techniques used will also determine how different soil types can impact the VWC% accuracy. The level of accuracy needed (from home gardeners to high-end research studies) and the sensor cost will determine what method of soil moisture measurement is best for agricultural applications.
Is Volumetric Water Content and Soil Water Potential the same thing?
In short, No. As discussed above, Water Content is the amount of water contained in a sample of soil. It tells you how much water is in the soil as a percentage of the total mass or volume of the soil. Soil Water Potential (also known as Soil Matric Potential (SMP)) describes how much energy is required by a plant to extract the water in the soil. It is described in units of pressure, usually kPa (kiloPascals).
Total Water Potential is the summation of its components:
- Omotic potential
- A pressure component
- A gravimetric component
- A potential due to humidity
- A potential due to fluid cohesion and surface tension (matrix potential)
- A reference correction
Of these, matrix (matric) potential is the component associated with soil characteristics. When water is in contact with solid particles (e.g., clay or sand particles within soil), adhesive forces between the water and the solid can be large. The forces between the water molecules and the solid particles in combination with attraction among water molecules promote surface tension and the formation of menisci within the solid matrix. Force is then required by plants to break these bonds and extract the water from the soil. The magnitude of matrix potential depends on several factors including (1) the distances between solid particles, (2) the chemical composition of the solid matrix (i.e., the type of soil), and (3) the amount of water in the soil.
This explains why understanding the type of soil in a field and the characteristics of their crop is so critical for farmers. Not only does the type of soil determine how much water can be held in the soil (and how quickly it will be shed after an irrigation event), but it also determines how much energy a plant needs to exert to get the water from the soil as the water content decreases.
There are specific sensors that measure water potential.
Soil Water Terminology
Some of the important terms when discussing Soila Moisture are:
Saturation
Occurs when all the voids in the soil are completely filled with water. This state is pretty easy to spot in the field as ponding of water will be evident for a lengthy period after the irrigation or precipitation event has stopped. The moment these event stop, loose water in the soil voids will begin to drain down past the plant root zone. Saturation of the soil should be avoided as it leads to:
- nutrients in the soil being drawn below the plant root zone, requiring additional fertilizer applications
- water uptake by the plant is impacted by the lack of oxygen in the soil at soil water contents greater than field capacity
If soil saturation is occurring through irrigation, irrigation water is being wasted as some of the water is immediately draining below the plant root zone and is no longer accessible to the plant.
Field capacity (FC)
The water content of the soil where all free water in large soil pores has been drained from the soil through gravity. From saturation, sandy soils may drain from saturation to field capacity levels within a few hours but fine-textured soils such as clay may take between 2-3 days. What is left is oxygen voids between soil particles and water attached to the soil through molecular or physical bonds. This combination of oxygen and water is the best condition for plant growth.
Field Capacity is expressed as a percentage of water in the soil; with typical VWC% values ranging from 20% in sandy soils to 40% in clay soils.
Field Capacity is a property of the soil type only. It is not impacted by the type of crop in the soil.
Permanent wilting point (PWP)
PWP is the soil moisture content at which soil particles hold the water so strongly that the plant is unable to apply enough force to extract the water from the soil. At this threshold, transpiration (water use by plants) and other processes vital to plant survival come to a near stop. This causes a significant reduction in crop growth and yield of crops.
Permanent Wilting Point is expressed as a percentage of water in the soil, with typical VWC% values ranging from 7% in sandy soils to 24% in clay soils.
Permanent Wilting Point is a property of the soil type but also varies by plant type as some plants can exert more force and extract more moisture from the soil than other types.

Total Available Water (TAW)
This is the amount of water available to the plant, calculated as the difference between the amount of water in the soil at field capacity and the amount of water at the permanent wilting point. Sandy soils cannot hold a large amount of water and have the lowest amount of TAW, whereas, medium-texture soils, such as silt loam and silty clay loam have the largest TAW. Therefore, sandy soils need to be irrigated more often than loam soils.
To ensure plants have sufficient water and do not endure any stress accessing the water, it is best to keep a plants TAW above 50%. This means overhead irrigation should start before the soil reaches 50% of Total Available Water. Drip irrigation should start before the soil reaches 80% of the Total Available Water.
TAW can be expressed as a %: TAW% = FC% – PWP%
It can also be expressed in the values of (1) inches of water per foot of soil or (2) mm of water per metre of soil.
- TAW (in. water/ft. soil) = TAW% x (12 in/ft)
- TAW (mm water/m soil) = TAW% x (1000 mm/m)
TAW is also referred to as:
- Available Water Storage Capacity[3]
- Water Holding Capacity
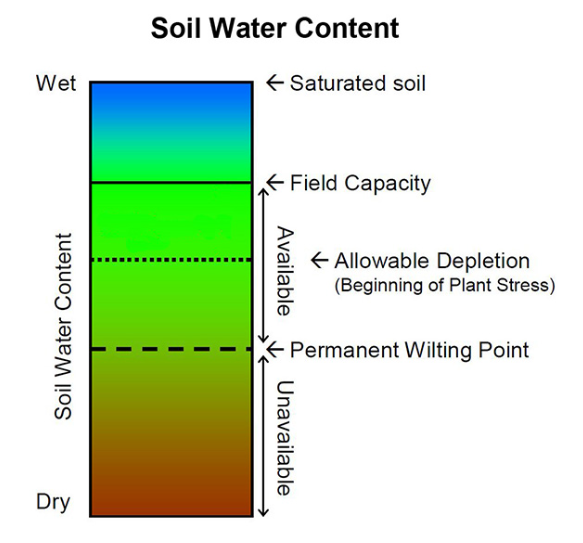
Figure 1.
[3] https://www.droughtmanagement.info/literature/BC_MA_Soil_Water_Storage_Capacity_2005.pdf
Deep Percolation
Refers to the water that drains beyond the plant root zone as a result of saturation.
All of these terms need to be taken in context for your particular crop, and in particular, the soil within your plant root zone. Any irrigation resulting in water percolating below the plant root zone is water that is lost to the plant. In times of water scarcity, this would be wasted water. The ideal amount of irrigation is when the water between the top and the bottom of the plant root zone is at Field Capacity but very little water has percolated below the root zone.
A common analogy used for visualizing all of these terms is using a fuel tank in a vehicle:
- Field Capacity represents when the tank is completely full
- Permanent Wilting Point represents the level of fuel at the bottom of the tank that can not be pulled into the engine by the fuel pump. No matter how empty your fuel gauge reads, there is always a little fuel at the bottom of the tank that cannot be accessed. In this example, the fuel pump is the roots of your plants.
- At tank Saturation, fuel is overflowing the tank and being lost
- TAW is the total amount of fuel that the tank can hold
- Deep percolation is the fuel that is lost when saturation occurs.
Plant Available Water (PAW)
Only a portion of the Total Available Water (TAW) in the plant root zone is easily accessed by the plant. As water is used (or evaporates), the remaining water is held by strong molecular forces to the soil particles, forces too strong for the pant to break This portion of water that is easily available to the plant is the Plant Available Water. It is commonly expressed as fifty percent of the Total Available Water but this percentage can vary as some plants are more capable of extracting moisture from the soil compared to others.
PAW is also commonly referred to as:
- Maximum Soil Water Deficit (MSWD)
- Management Allowable Depletion (MAD)
If the Soil Moisture (VWC%) goes below the PAW%, the plant will begin to experience water stress and potential growth reduction. The further below the PAW% the moisture level gets, the more stress the plant is put under. Unlike TAW thresholds which are a function of soil type alone, PAW thresholds are a function of stress tolerance, growth stage, and water usage by the plant.
Soil Texture (Soil Type)
Soil Texture refers to the feel of soil. Soils are made up of different amounts of sand, silt, and clay. There are 12 soil textural classes according to the USDA classification system, with each soil texture having varying responses to water.
Soil texture is also known by the term Soil Type.
The United States Department of Agriculture textural Classification Triangle (Figure 1) shows the different soil types according to their respective percentages of Sand, Silt, and Clay.

Figure 2.
Soil Structure
Structure is the arrangement of soil particles and soil aggregates into recognizable particles or lumps. Aggregates occur in almost all soils, but their strength, size, and shape vary between soil types.
Aggregates can be loose and friable, or they can form distinct, uniform patterns. For example, a granular structure is loose and friable, a blocky structure is six-sided and can have angled or rounded sides, and a platelike structure is layered and may indicate compaction problems.
Soil porosity refers to the space between soil particles, which consists of various amounts of water and air. Porosity depends on both soil texture and structure. For example, a fine soil has smaller but more numerous pores than a coarse soil. A coarse soil has bigger particles than a fine soil, but it has less porosity or overall pore space. Water can be held tighter in small pores than in large ones, so fine soils can hold more water than coarse soils.
Soil structure has a significant impact on water movement from the soil surface down past the plant root zone. [4]
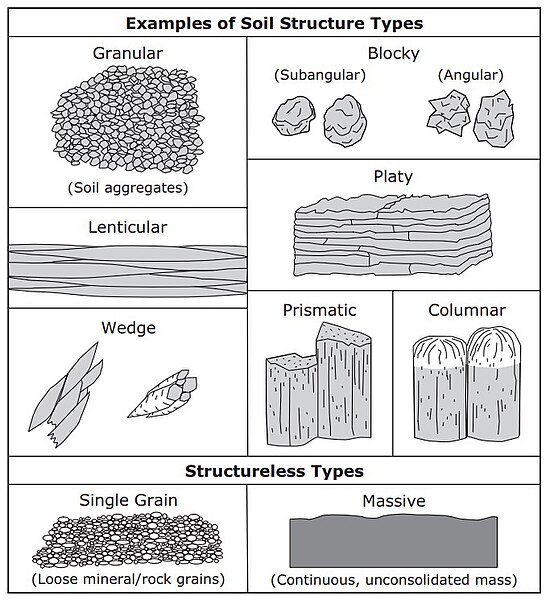
Figure 3.
The Class of structure describes the average size of individual aggregates; of which there are 5 general classes:
- Very fine or very thin;
- Fine or thin;
- Medium;
- Coarse or thick;
- Very coarse or very thick.
The Type of structure describes the form or shape of individual aggregates. Generally, soil technicians recognize seven types of soil structure, but here only four types are used[5]:
- Granular and crumb structures are individual particles of sand, silt, and clay grouped in small, nearly spherical grains. Water circulates very easily through such soils. They are commonly found in the A-horizon of the soil profile;
- Platy structure is made up of soil particles aggregated in thin plates or sheets piled horizontally on one another. Plates often overlap, greatly impairing water circulation. It is commonly found in forest soils, in part of the A- horizon, and in claypan soils
- Blocky and Subangular Blocky structures are soil particles that cling together in nearly square or angular blocks having more or less sharp edges. Relatively large blocks indicate that the soil resists penetration and movement of water. They are commonly found in the B-horizon where clay has accumulated;
- Prismatic and Columnar structures are soil particles that have formed into vertical columns or pillars separated by miniature, but definite, vertical cracks. Water circulates with greater difficulty and drainage is poor. They are commonly found in the B-horizon where clay has accumulated.
Going back to the fuel tank analogy, imagine the interior of the fuel tank is a sponge. The size of the holes in the sponge represents the type of soil in the field (the soil texture). The fuel pump can easily extract the fuel within the sponge when the sponge is fully saturated; but as the amount of fuel in the sponge decreases, the amount of force required to extract more fuel will grow, until the pump is no longer able to extract any more fuel. The smaller the holes in the sponge (or the finer the texture of the soil) the harder it is to extract the fuel from the sponge (or water from the soil).
In this new model, the Plant Available Water is the amount of fuel the pump can extract from the sponge before it no longer has the power to extract more.
[4] https://www.noble.org/regenerative-agriculture/soil/soil-and-water-relationships/
[5] https://www.fao.org/fishery/static/FAO_Training/FAO_Training/General/x6706e/x6706e07.htm
How soil type affects soil moisture
The amount of water available to the plants depends on the texture of the soil.
- Sand: Sandy soils have the largest particle size, which allows water to drain quickly. As a result, sandy soils tend to dry out faster. Sandy soils have low water and nutrient-holding capacity and struggle to retain sufficient amounts for crops. Shallow-rooted crops are more susceptible to drought stress in sandy soils, as they may experience water deficits that hinder their growth and yield.
- Silt: Silty soils have medium-sized particles, providing better water retention than sandy soils. They have moderate water-holding capacity and drainage characteristics. During drought, silty soils can retain moisture for longer periods compared to sandy soils. Silty soils have more plant-available water capacity than clayey soils.
- Clay: Clay soils have lots of small fine particles with many inner layers creating lots of surface areas that hold water and nutrients tightly. They have higher water and nutrient holding capacity but lower drainage, resulting in slower water movement and potential waterlogging. Also, they have lower plant available water capacity than silty soils because clays hold water tightly as they dry. During drought, clay soils can retain moisture relatively well, which benefits crops like corn, soybeans, and wheat. However, excessive water retention in clay soils can also lead to root oxygen deprivation and negatively impact crop growth in wet years. Any crop with a deeper root system may perform better in clay soils during drought as it can access the stored water.
- Loam: Loam is soil composed mostly of sand (particle size > 63 micrometres), silt (particle size > 2 micrometres), and a smaller amount of clay. Loam soils generally contain more nutrients, moisture, and humus than sandy soils, have better drainage and infiltration of water and air than silt- and clay-rich soils, and are easier to till than clay soils. Loam soils generally offer the best characteristics for growing most plant varieties.
The field capacity and permanent wilting points are shown in the table below for various soil textures. You don’t need to remember these levels. The ConnectedCrops mobile app automatically sets the Field Capacity and Permanent Wilting Point thresholds based on the soil type selected when the sensor is configured.
| Soil Texture | PWP% | FC% | Total Available Water (TAW) | ||
| TAW% | (in. water / ft. soil) | (mm water / m soil) | |||
| Sand | 3.5 | 11 | 7.5 | 0.9 | 75 |
| Loamy Sand | 5 | 17.5 | 12.5 | 1.5 | 125 |
| Sandy Loam | 10 | 22.5 | 12.5 | 1.5 | 125 |
| Loam | 12.5 | 25 | 12.5 | 1.5 | 125 |
| Silt | 12 | 34 | 22 | 2.64 | 220 |
| Silt Loam | 13.5 | 30 | 16.5 | 1.98 | 165 |
| Sandy Clay Loam | 16.5 | 27.5 | 11 | 1.32 | 110 |
| Sandy Clay | |||||
| Clay Loam | 18 | 32 | 14 | 1.68 | 140 |
| Silty Clay Loam | 20 | 34.5 | 14.5 | 1.74 | 145 |
| Silty Clay | 22.5 | 36.5 | 14 | 1.68 | 140 |
| Clay | 24 | 37.5 | 13.5 | 1.62 | 135 |
Source: OMAFRA (2001)[6], Ratliff et al. (1983); Hanson et al. (2000)
[6] https://www.ontario.ca/page/monitoring-soil-moisture-improve-irrigation-decisions#ref-1
How can I determine my Soil Texture?
As shown, knowing the Soil Texture classification of your soil is critical to understanding the correct Soil Moisture range you should target for your crop and planning your irrigation strategy. Determining what soil texture you have can be done in two ways:
- Laboratory Analysis: This is the recommended approach as it is the most accurate and will come with a lot more information about your soil beyond texture. It will provide a breakdown of the percentage of sand, silt, and clay in your sample, which can be used in Figure 2 to determine your soil texture classification.
You can also use a spreadsheet developed by the US Department of Agriculture to identify your Soil Texture using these lab results[7].
- Hand Texturing: this approach involves extracting a sample of soil from the depth of interest and performing several steps to get a reasonably accurate classification of our soil type. Either of the following online resources can be used for this procedure:
- Estimating Soil Texture by Feel[8]
- Estimating soil Texture by hand[9]
- Soil Texture Feel Method[10]
[7] https://www.nrcs.usda.gov/resources/education-and-teaching-materials/soil-texture-calculator
[8] https://bookstore.ksre.ksu.edu/download/estimating-soil-texture-by-feel_MF2852
[9] https://www.agric.wa.gov.au/soil-constraints/soil-texture-estimating-hand#:~:text=Add%20enough%20water%20to%20make,the%20soil%20is%20very%20sandy
[10] https://www.nrcs.usda.gov/sites/default/files/2022-11/Texture%20and%20Structure%20-%20Soil%20Health%20Guide_0.pdf
What is my ideal soil moisture level?
As described above, to avoid water stress in your crop, it is best to keep your soil moisture level above the Plant Available Water level; therefore, your ideal soil moisture level is between the VWC% at field capacity and the VWC% at Plant Water Available. As an example, if your soil type is Sandy Loam:

Equation 3
So, the field soil moisture should stay between 16.25 and 22.5 VWC%.
In the ConnectedCrops Mobile App (“CCMobile App”), a user might then set up their notifications thresholds as follows:
| Threshold Name | VWC% |
| Field Capacity | 22.5 |
| High Soil Moisture Threshold | 20.5 |
| Low Soil Moisture Threshold | 16.5 |
| Permanent Wilting Point | 10 |
With these settings, the CCMobile App user will get a notification if:
- the VWC% exceeds the Field Capacity (over irrigation or excessive precipitation)
- the VWC% exceeds the High Soil Moisture Threshold level (plan to end irrigation if occurring)
- the VWC% is below the Plant Available Water level (time to start irrigation)
- the VWC% is below the Permanent Wilting Point (irrigation is critical)
Once you get more experience tracking soil moisture readings, you will be able to fine you’re your threshold values according to your soil type, crop type, growth stage etc.
What is a normal soil moisture reading?
Volumetric Water Content (“VWC”) is expressed as a percentage or ratio of the amount of water held by the soil. For example, one cubic meter of soil with 30% VWC contains 0.3 cubic meters, or 300 litres, of water. Typical VWC readings are between 5% and 35%, depending on your soil type.
ConnectedCrops soil sensors provide research-grade accuracy in mineral soil – however, they aren’t designed to work in pure air, pure water, or custom soils. If you are monitoring VWC in potting soil, or custom soil mixes with different levels of organic content, contact support and have your sensors recalibrated.
Viewing soil moisture data on your phone
When you launch the ConnectedCrops mobile app, you will see a dashboard view where you can see your stations and the current reading for each sensor. The mobile app will look like this:
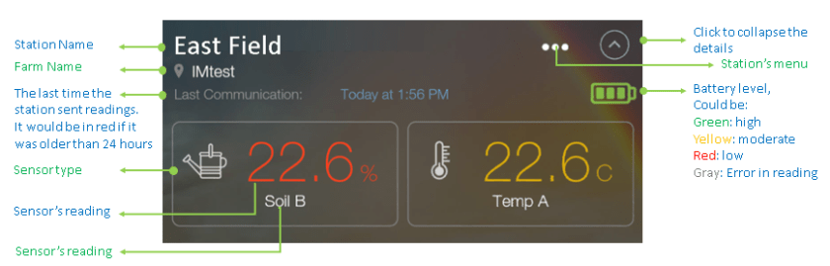
The soil moisture reading will be color-coded based on your soil type and the thresholds you have set. Colors:
Green – VWC reading is between the High Soil Moisture Threshold and the Low Soil Moisture Threshold
Yellow – VWC reading is approaching either Field Capacity or Wilting Point
Red – VWC reading has exceeded either Field Capacity or Wilting Point
For advanced features, the Connected Crops mobile app allows you to export the data to Excel for further analysis.